
EPFLSTILOBMarcel LeuteneggerAbout
Super-resolution fluorescence microscopy
Overcoming the diffraction limit
|
EPFLSTILOBMarcel LeuteneggerAbout Super-resolution fluorescence microscopy Overcoming the diffraction limit |
|---|
Fluorescence microscopy provides outstanding spatio-temporal resolution, sensitivity and selectivity for investigating biological samples at the sub-micrometer scale. It has become, and still it is, the workhorse in life science and biomedical research. The spread of the confocal microscope into the laboratories in the 80s and 90s marked the last significant improvement of visible light microscopy. This step was long believed to be the final one because the spatial resolution reached the diffraction limit imposed by the wave nature of light and, at the same time, single photon detectors reached the shot noise limit imposed by the quantum nature of light.
Ernst Abbe postulated the diffraction limit by recognizing that the ability of an optical system to distinguish the images of two features of an unknown object is limited by the wavelength and by the collection angle of the observed light. The condition "unknown" had shifted out of the focus of the scientific community and it required Stefan W. Hell and coworkers to raise this point on the board again in the early 90s [1]. If one has prior knowledge about some properties of the observed object, the diffraction limit can be overcome indeed. For instance, if simultaneously indistinguishable features can be forced to light up one by one, it is possible to transfer diffraction unlimited spatial information via these intensity fluctuations. That is spatial information can be enhanced if one is able to (partially) transcode it into other information channels, for instance time, color or polarization.
In his pioneering work, Stefan W. Hell showed that fluorophores can be imaged much more precisely if one switches off most of them in a controlled manner [2]. He achieved this by stimulating the emission of a photon of excited fluorophores via a red-shifted laser beam. This is the very same process used in a laser gain medium to keep the laser going. If this stimulated emission takes place much faster than the spontaneous emission of the fluorophore, the fluorophore's ability to fluoresce can effectively be inhibited and it becomes dark. Lighting a bunch of fluorophores with a doughnut shaped stimulation beam allows switching off all fluorophores except those that are in the very vicinity of the central intensity minimum. This region of spontaneously emitting fluorophores gets the narrower the more fluorophores are switched off. Thereby the spatial resolution is driven beyond the diffraction limit. This method is called stimulated emission depletion (STED) as it transiently depletes the excited state of fluorophores by stimulated emission.
The invention of STED fostered a panopli of super-resolution fluorescence microscopy techniques that emerged since. Prominent super-resolution methods are saturated structured illumination microscopy (SSIM) [3], (direct) stochastic optical reconstruction microscopy (dSTORM) [4,5], (fluorescence) photoactivated localization microscopy (fPALM) [6,7], and super-resolution optical fluctuation imaging (SOFI) [8,9]. As of 2011 all these methods transcode spatial information in time by exploiting the emission fluctuations of fluorophores or quantum dots.
The study of cell membrane processes requires non-invasive observation techniques that achieve a sufficient spatio-temporal resolution for observing proteins and or lipids in their natural environment. This kind of investigation is now possible thanks to STED fluorescence spectroscopy. STED allows increasing the spatial resolution to better than ~30nm, which is well suited for observing lipid diffusion and lipid-protein or lipid-lipid interactions at the nanoscale. And spectroscopic method such as fluorescence correlation spectroscopy (FCS) support the temporal resolution for following these processes.
Eggeling, Ringemann, Mueller et al. investigated and compared the diffusion of different lipids in the membrane of living cells [10,a,b]. Using STED for tuning down the probed area to spot diameters as small as ~30nm, STED-FCS revealed that phosphoglycerolipids (PE) diffused mostly free, whereas sphingolipids (SM) and glycosylphosphatidylinositol-anchored proteins were transiently trapped in cholesterol-mediated molecular complexes, where they dwelled during ~1020ms within ~20nm diameter areas. This finding supports the existence of lipid nanodomains (rafts) by measuring the diffusion behaviour on scales comparable to the size of the much debated rafts.
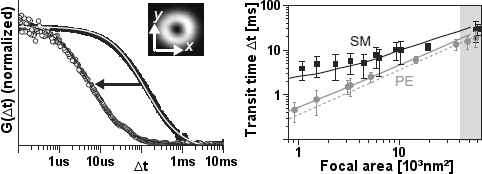
Figure 1: STEDFCS on lipid membranes [a]. Left: Correlation data G(Δt) and fits (gray lines) of Atto647N-PE in a multilamellar lipid membrane layer at confocal (discs) and STED recording (circles) with the doughnut-shaped intensity distribution. Right: Lipid diffusion in the plasma membrane of living PtK2 cells. Fitted transit times Δt of Atto647N-labeled PE (circles) and SM (squares) versus the focal spot areas of the STED-FCS recordings. The error bars result from averaging over more than 30 FCS measurements on different cells. A comparison to the linear decrease with the focal area (grey dotted line) shows nearly free diffusion for PE and pronounced hindered diffusion of SM. These behaviours can hardly be discerned with confocal recordings (grey shaded area).
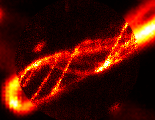
In a further approach, we investigated this topic by an independent method based on single molecule tracking. Tracking individual fluorophores at nanoscale precision remains challenging because the transit time through an area of ~20nm in diameter is typically shorter than ~1ms. We managed to achieve this demanding combination of sufficient spatial accuracy and high temporal resolution by a confocalized tracking instrument, which detects the fluorescence on several single photon detectors [c,i]. Single photon detection offers the advantage of shot noise limited detection and allows analyzing the photon traces in all flexibility. We achieved a time resolution of better than 1ms by analyzing the photon traces in bins of a fixed number of photons instead of fixed time intervals. Therefore, the lag time between two localizations could be kept at a minimum, in particular in the focal center where the count rate was maximal. Figure 2 outlines the instrument and the essential steps of the analysis. The diffusion statistics allowed us to extract and confirm an average dwelling time of ~10-15ms within domains smaller than 60nm in diameter for SM, whereas PE was marginally trapped during ~3ms if at all.
![]()
Figure 2: Principle of fast confocalized single molecule tracking [c]. Fluorescence excited in the focal region is imaged onto a quasi-confocal detector array. The count rates on three single photon detectors allow tracking single fluorophores at ~10nm precision within ~1ms. (A) Fluorescence burst selection based on the total count rate. (B) Zoom into one burst showing the relative detector count rates in color. (C) Retrieved track of the fluorophore during its focal transit. (D) Statistical analysis of the fluorophores mobility. P(Δr²,Δt) is the probability of finding the fluorophore within a square displacement Δr² after the lag time Δt.
Many of the growing demands for diffraction-unlimited far-field imaging and spectroscopy at the molecular scale can be satisfied with STED microscopy. Whereas it became relatively simple to strongly improve just the lateral [11] or the axial [12] resolution by STED, a large improvement of resolution along all spatial directions requires more complex instrumentation [13-15]. For applications that need just the axial volume reduction but no imaging along the optical axis, for instance spectroscopic investigations near a (glass) surface, confining the measurement to a surface is acceptable. By giving up the far-field wave propagation along the optical axis, one can resort to total internal reflection (TIR) as a means to reduce the axial extent of the measurement volume [16].
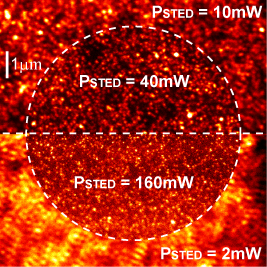
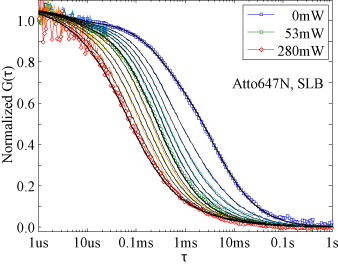
We developped a full theoretical description of the sampling volume of TIRF-STED nanoscopy and examined the advantages and limitations of confocal epi-TIRF-STED nanoscopy for imaging and fluorescence correlation spectroscopy (FCS) measurements [d,e]. We found that the polarization of the laser light is critical, as well as the side lobes of the TIR excitation spot. In our approach, the confocal pinhole blocked the emission induced by all side lobes except the first one, from which the emission of the fluorophores was then actively inhibited by STED. Applying a higher STED power than required for the side lobe suppression allowed increasing the sharpness of the central peak (figure 3). As a result, an almost isotropic observation volume of less than one attoliter and <50nm diameter was achieved and FCS measurements could be performed in areas of <40nm diameter (figure 4), even in the presence of strong out-of-focus background caused by a freely diffusing hydrophilic dye [h].
 |
 |
|---|---|
| Figure 3: Normalized images of 20nm fluorescent beads immobilized on the cover slip for STED powers of 2mW to 160mW [e]. Area 10×10μm², scanning step size 10nm and dwell time 100μs. | Figure 4: TIRF-STED-FCS. Normalized measured (colored) and fitted (black) autocorrelation curves for DOPE-Atto647N diffusing in a supported lipid bilayer for STED powers of up to 280mW [e]. The extracted diffusion coefficient of the labelled lipid was D ~ 5.0μm²/s. |
STED is a versatile method both for imaging and spectroscopy at the nanoscale. The short excited state lifetime allows switching fluorophores on and off instantaneously. But because the fluorophore has to be switched off at every single emission cycle, switching intensities of many MW/cm² are required. Such fast switching is not required for imaging. Therefore, other switching mechanisms have been investigated. Promising candidates are metastable dark states of fluorescent proteins for instance. These dark states can last for seconds to minutes such that the switching can be performed many orders of magnitude slower than with STED (ms than ps).
Thousands of mutants of an enhanced green fluorescent protein (EGFP) were seeked for the desired switching behaviour, which finally resulted in a reversibly switchable variant (rsEGFP). This fluorescent protein can be photoswitched more than a thousand times between a bright green fluorescent state and a metastable dark state [g]. Distributions of functional rsEGFP-fusion proteins in living bacteria and mammalian cells were imaged at better than 40nm resolution. Dendritic spines in living brain slices were super-resolved with about a million times lower light intensities than before. And the reversible switching also enabled all-optical writing of features with subdiffraction size and spacings, which can be used for data storage.
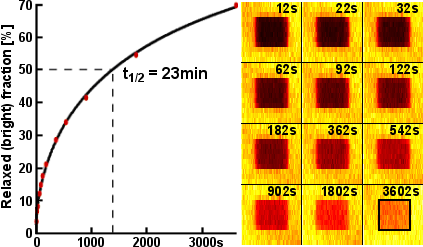
For example, we sandwiched rsEGFP in a thin polyacrylamid (PAA) layer between two cover slips and stored 25 stories of Grimm's fairy tales in a 17×17μm² small area. The stories were written in frames of 41 characters (287 bits) in this area and read back a few seconds later. This process was repeated nearly 6600× until all characteres were stored. Figure 5 shows such a frame and figure 6 outlines the lifetime of the metastable dark state, which lasts for ~23 minutes.
 |
 |
|---|---|
| Figure 5: Frame storing 287 bits of 41 characters in a thin rsEGFP-PAA layer of 17×17μm² area [g]. Ones were stored as bright spots and well recognized by applying an intensity threshold. The bottom-left corner is slightly out of focus. Video of 250 frames out of all 6596 frames. | Figure 6: Relaxation of rsEGFP into the bright equilibrium state [g]. An area of 12×12μm² was turned on by irradiation with 405nm light. In the indicated 6×6μm² square, all rsEGFP were then turned off by irradiation with 491nm light. After some time, the area was imaged with 491nm light and the fraction of thermally relaxed rsEGFP was estimated as the ratio of the average fluorescence brightness inside the square over the average brightness of the surrounding frame. |
rsEGFP switches on upon irradiation with light of ~405nm wavelength. In the bright state, rsEGFP gets excited by light with a wavelength of ~491nm and emits then in the green range. Concurrently to the fluorescence emission rsEGFP returns to the metastable dark state. Therefore, the number of emissions per switching cycle is limited. Fortunately, a mutant of the yellow fluorescent protein Citrine was found to switch on and off independently of the fluorescence excitation: Dreiklang switches on upon irradiation with ~365nm light, switches off upon irradiation with ~405nm light and fluoresces upon excitation with ~515nm light [h]. Because of the decoupled switching, Dreiklang can be used for both targeted and stochastic super-resolution imaging as exemplified in figure 7.
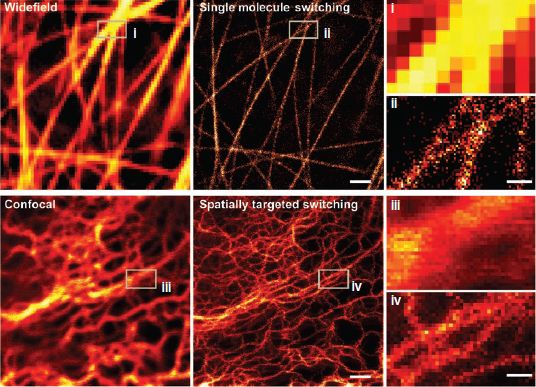
Figure 7: Super-resolution microscopy of living PtK2 cells using Dreiklang [h]. Top: Cells expressing Dreiklang-Map2 imaged both conventionally (left) and by super-resolution microscopy based on single-molecule stochastic switching (center). Bottom: Keratin19-Dreiklang expressed in living cells and imaged both confocally (left) and in the RESOLFT mode (spatially targeted switching) (center). Right: magnifications of the regions indicated in the main images. Scale bars: 1μm (middle, left), 250nm (right).
The author is a fellow of the Alexander von Humboldt foundation and the Max Planck society.
© 2014 École Polytechnique Fédérale de Lausanne