
EPFLSTILOBMarcel LeuteneggerAbout
Focus field calculations
A comprehensive framework
|
EPFLSTILOBMarcel LeuteneggerAbout Focus field calculations A comprehensive framework |
|---|
Modern fluorescence microscopy provides outstanding spatio-temporal resolution, sensitivity and selectivity for investigating biological samples at the sub-micrometer scale. Due to these properties, it has become the method of choice in life science and biomedical research. Besides impressive improvements in image resolution and contrast, the need for quantitative measurements becomes more and more important. Fluorescence fluctuation spectroscopy (FFS) with correlation analysis (FCS) [1,2], intensity distribution analysis (FIDA, PCH) [3,4] or Förster resonant energy transfer (FRET) [5] addresses these demands. For these quantitative measurements, knowledge of the optical point spread function is required. This corresponds to the brightness profile of the detected fluorescence, which demands the combined calculation of the excitation focus field, the response of fluorescent markers and finally the detection efficiency. This allows accurately modeling and predicting the measured fluorescence signal as recently shown in detail by Enderlein et al. [6].
The physical concepts of focusing electromagnetic waves and detecting dipole waves are well-known and described for instance by Török, Higdon and Enderlein [7,8,9,10]. In analogy to the classical Debye formulation [11] and the seminal work by Wolf and Richards [12,13], we reformulated the calculation of the electromagnetic field in the focus of high numerical aperture objectives based on a Fourier or chirp z transform [a,b] and achieved unprecedented calculation speed and flexibility. These calculations yet describe the excitation fields and thereby the excitation rates of fluorophores within these foci.
 |
 |
|---|---|
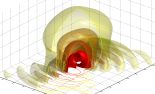
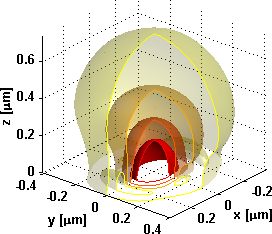
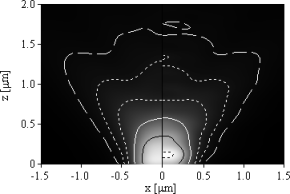
| Figure 1: Excitation intensity at a glass-water surface with a 1.45 NA oil immersion objective with overfilled aperture at 488nm wavelength. | Figure 2: Fluorescence detection efficiency at a glass-water surface with a 1.45 NA oil immersion objective at 525nm wavelength. |
We also revisited the induced fluorescence emission based on the classical reciprocity principle in order to calculate accurately the detection efficiency within the same rapid and flexible framework [c]. Our calculation accounts for the anisotropic distribution of the emitted fluorescence and yields the absolute detection efficiency through normalization with the total radiated power of the fluorophore [10].
 |
 |
|---|---|
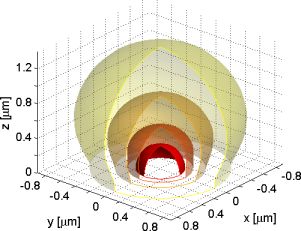
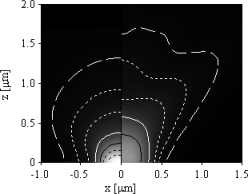
| (a) 100×1.45 NA oil immersion (left) and 40×1.20 NA water immersion objective (right). | (b) 40×1.20 NA water immersion objective on the glass side (left) and the sample side (right). |
Figure 3: Detection effciency of isotropically oriented fluorophores for immersion objectives focused on the cover glasssample interface. Black dotted lines outline an effciency of 20% and 15%, black solid lines of 10%, white solid lines of 5%, dotted lines of 2% and 1% and ticked lines of 0.5%, respectively.
We presented a complete framework for accurately calculating focus fields generated with high numerical aperture objectives and for calculating the detection effciency of fluorescence emission at interfaces. The polarization, phase and amplitude distributions of the propagated electromagnetic fields are fully taken into account as well as the spatial distribution of the emitted fluorescence. We presented examples for fluorescence excitation and detection at a glasswater interface and compared the detection yields for total internal reflection fluorescence microscopy in epi- and trans-illumination. These calculations clearly show the superiority of the 1.45 NA objective for epi-TIRF, firstly because it outperforms the detection effciency as well as the resolution of the 1.20 NA objective and, secondly, because it is able to provide an evanescent illumination without further equipment.
We thank Herbert Gross, Carl Zeiss Oberkochen for many valuable comments and discussions.
This work was funded in part by the Swiss National Science Foundation (SNSF #200021-103333) and the European Commission (FuSyMEM project).
Downloading this focus field calculation framework, you accept the copyright terms of the GNU Lesser General Public License version 2.1.
© 2011 École Polytechnique Fédérale de Lausanne